
Summary
I did not want to build another vague sustainability feature for cloud. I wanted to build something much more uncomfortable: a way to make waste visible. Because waste in cloud is rarely just about carbon. It is also about money, discipline, architecture and whether anyone is still in control of what is running.
There is a pattern in cloud that bothers me more than it should.
The more complex the platform, the easier it often becomes to stop asking basic questions. What is running? Why is it still running? Who owns it? What does it cost? What footprint does it create? Is it still needed? Or did someone spin it up three months ago, forget about it, and leave it there quietly burning money, energy and attention in the background?
That is one of the personal reasons I wanted WAYSCloud to build Climate Insights.
Not because I felt like adding a fashionable sustainability module. And not because I wanted a soft, decorative dashboard that makes infrastructure look responsible while nobody actually changes anything. I wanted something more useful than that. I wanted a way to expose a part of cloud operations that is too often hidden behind abstraction, convenience and, in some cases, business models that benefit from customer inattention.
Because that is the uncomfortable truth here: cloud waste is often not accidental in practice. It is often made easy.
For the formal product announcement, see WAYSCloud introduces Climate Insights across platform services.
The problem is not just carbon. It is cloud laziness at scale.
A forgotten instance is not just a technical oversight.
It costs money. It consumes energy. It increases noise. It makes infrastructure harder to understand. And in some cases, it creates security exposure simply by continuing to exist outside active attention.
That is the part I think too many people tiptoe around.
An idle or underused service is not just “inefficient.” It is a sign that the platform and the operating model may no longer be helping the customer stay in control. If the default outcome of complexity is that unnecessary resources keep running because nobody sees them clearly enough to challenge them, then the platform is not only expensive. It is undisciplined.
And yes, that has a climate dimension. Every unnecessary service, every oversized footprint, every resource left running without purpose contributes to operational waste. But it also has a cost dimension, and a governance dimension, and sometimes a security dimension. If you lose visibility over what exists, you do not only lose optimization opportunities. You lose control.
That is why I wanted Climate Insights to exist.
Not as sustainability theater, but as a visibility tool for operational discipline.
I do not buy the idea that opacity is a feature
One thing I have seen repeatedly in cloud is that complexity tends to favor the provider more than the customer.
Complex systems make it easier to justify abstraction. Abstraction makes it easier to reduce visibility. Reduced visibility makes it easier for waste to persist. And persistent waste tends to be very good business for whoever gets paid by the running unit, the allocated capacity, the forgotten storage, or the quietly spinning service nobody remembers to shut down.
That does not mean every provider is acting in bad faith. But it does mean the incentives are not always aligned with customer clarity.
And that is where I fundamentally differ from a lot of the market.
I do not think cloud should become more opaque as it becomes more powerful. I do not think the customer should need detective work to understand what they are running, what it is costing them, what footprint it creates, and whether it still deserves to exist. I do not think “just trust the platform” is good enough when the platform profits from your inattention.
Climate Insights came out of that frustration.
I wanted to build something that helps customers ask sharper questions instead of making them more dependent on softer answers.
Why footprint visibility also reduces cost
One of the reasons this matters is that environmental efficiency and cost efficiency are often closely related in day-to-day infrastructure.
If a workload is clearly oversized, underused or left running without purpose, you are usually looking at two waste streams at once: unnecessary spend and unnecessary operational footprint. The same cleanup that reduces estimated CO₂e often reduces monthly cloud cost. The same visibility that helps spot waste in service behavior also helps identify dormant resources, low-activity services and badly matched allocations.
That is why I never wanted Climate Insights to be framed only as a climate feature.
That would actually undersell it.
What I wanted was a module that helps make waste visible in a broader operational sense. If a customer can see where estimated footprint is rising, compare trends over time, and trace that back to service categories and usage patterns, then the value is not just environmental. It is financial and architectural as well.
And that matters, because cloud overspend is often not caused by some dramatic failure. It is caused by small acts of inattention repeated at scale. A service left running. Storage never cleaned up. Capacity never resized. Zones never removed. Environments kept alive because nobody wants to touch them. These are ordinary failures of visibility, and they add up.
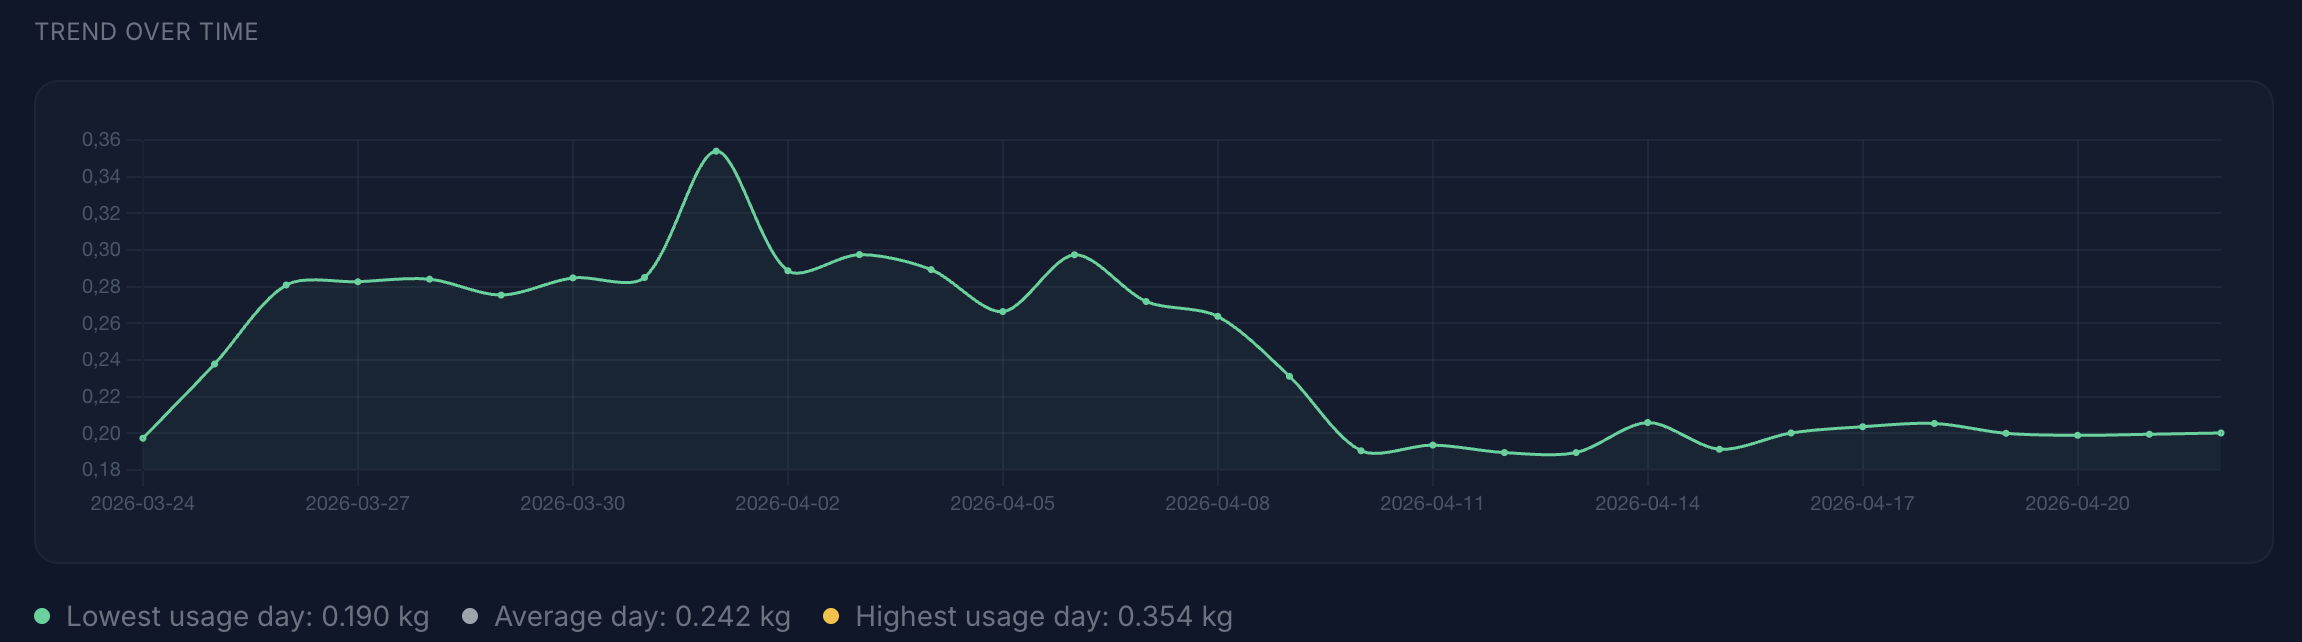
The point of the trend view is not to make the interface look more sophisticated. It is to make waste harder to ignore. A single snapshot can be reassuring, but it does not show whether the environment is becoming cleaner or just more familiar. Drift is where a lot of cloud waste hides: services that keep running because nobody revisits them, resources that stay oversized because nothing forces the question, and infrastructure that slowly becomes more expensive and less disciplined without anyone noticing in time. Showing estimated footprint over time makes that drift visible. And once it becomes visible, it becomes much harder to defend doing nothing.
Waste can also become a security problem
This is another part I think deserves more honesty.
If you stop having clear visibility over what exists in your environment, security does not remain untouched by that.
Forgotten or weakly owned instances can become neglected instances. Neglected instances do not always get reviewed, patched, resized, retired or questioned properly. Sometimes they just sit there — invisible enough not to be challenged, alive enough to remain part of the environment. That is not a theoretical issue. In any sufficiently messy cloud estate, forgotten infrastructure becomes operational drag and potential attack surface at the same time.
So when I talk about footprint visibility, I am not talking about some isolated sustainability concern.
I am talking about whether the platform helps organizations maintain situational awareness over their own infrastructure.
That includes cost. That includes efficiency. And yes, that can include security.
Because a cloud environment that becomes harder to inspect over time is not only more expensive and more wasteful. It is often riskier too.
Why I wanted to build this differently
I did not want to build a module that produces one giant reassuring number and calls it insight.
I wanted something more honest than that.
Climate Insights uses usage data, regional grid intensity and service-specific models to estimate energy use, CO₂e and efficiency signals across supported WAYSCloud services. That is useful, but it is still modeling. And I think platforms should be explicit about that. In some areas confidence is stronger. In others, assumptions and proxies inevitably play a larger role.
That is why I wanted the feature to be transparent about scope, methodology and limitations.
It focuses on Scope 2 operational energy using location-based accounting. It does not pretend to include everything. It does not blur estimates into audited carbon truth. It does not try to win trust by sounding more certain than the model actually is.
To me, that is not a weakness. It is part of the point.
If you want customers to trust what they are seeing, then the system should be clear about what is measured, what is inferred, and where the uncertainty sits.
That is how useful visibility is built.
If you want the technical service description, methodology notes and scope details, they are documented here: Climate Insights documentation.
Why this is personal to me
At a deeper level, this feature is personal because it comes from a broader conviction I have about infrastructure.
I think systems should become easier to understand as they become more important, not harder. I think customers should be able to inspect the operational reality behind the services they run. I think trust is stronger when it grows out of clarity instead of marketing language. And I think too much of the cloud market has normalized a model where opacity, sprawl and passive overspend are treated as natural side effects of scale.
I do not accept that.
I think a good platform should make it easier to see waste, easier to clean up, easier to optimize, and harder to ignore what is quietly running in the background. If that also reduces carbon footprint, good. If it also reduces cloud cost, even better. In practice, it often does both.
That is exactly why I wanted Climate Insights inside WAYSCloud.
Not to moralize infrastructure. Not to decorate it. But to expose it more clearly.
Closing
So the personal reason I wanted to build Climate Insights is fairly simple.
I wanted to make cloud waste harder to hide.
Because hidden waste is not just a climate issue. It is a cost issue. It is an architecture issue. It is a visibility issue. And sometimes it is a security issue too.
A platform that makes it easy to forget what is running is not doing the customer any favors. It is just turning opacity into margin.
I wanted to build something that pulls in the opposite direction.
Something that makes it easier to see what is there, what it costs, what footprint it creates, and what should probably not still be running at all.
That, to me, is far more interesting than another vague sustainability claim.